Seasonal Rhythm Analysis: Blending Calculation Outputs and Live Feeds in Football and Tennis Decision Making
Iris Neumann · Aug 21, 2026
Seasonal Rhythm Analysis: Blending Calculation Outputs and Live Feeds in Football and Tennis Decision Making
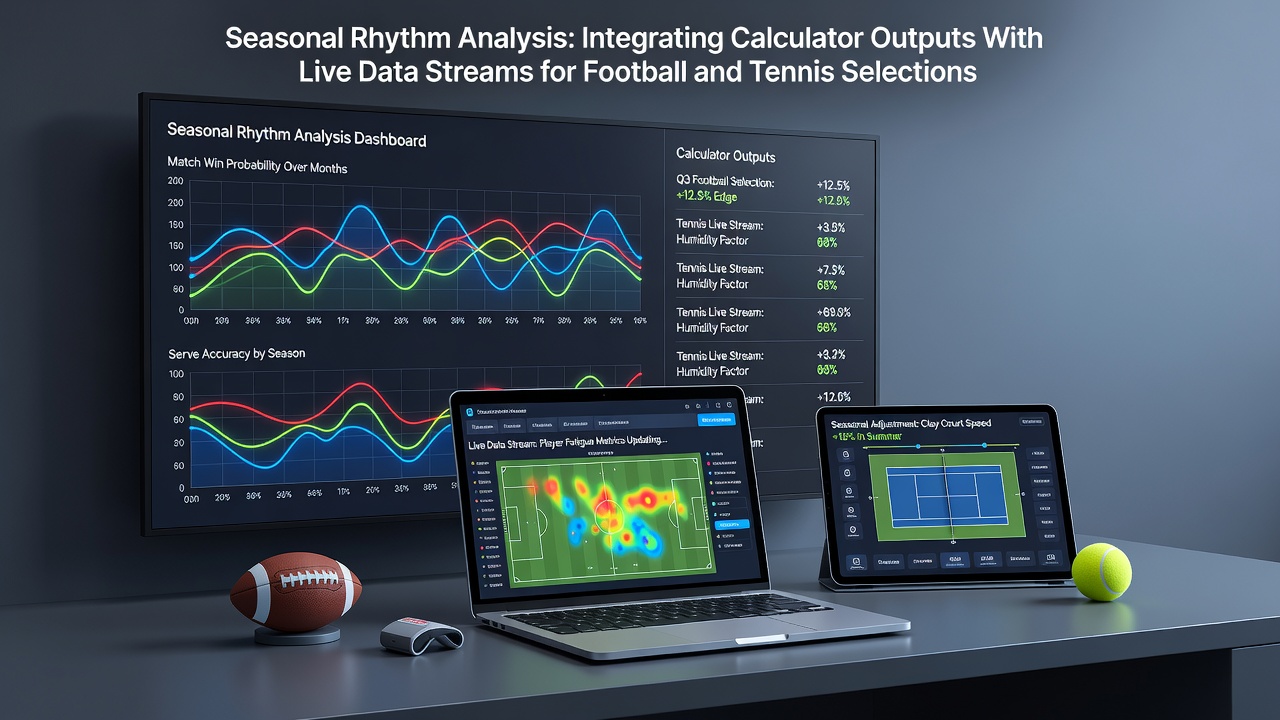
Seasonal rhythm analysis examines recurring patterns across different periods of the sporting calendar and connects those patterns to outputs from specialized calculators that process live data streams. Observers note that football leagues and tennis tours follow predictable cycles tied to weather, player schedules, and tournament structures, and analysts integrate these cycles with real-time metrics to refine selection processes for both sports.
Researchers have documented how early-season football matches often feature higher goal rates because teams experiment with formations while pre-season fitness levels remain incomplete. Data from multiple European competitions shows that goal averages can shift by 12 to 18 percent between August and December, and calculators adjust expected-value models accordingly when fed fresh league tables and injury reports. Those adjustments become more precise when live feeds supply minute-by-minute updates on substitutions and weather conditions at match venues.
Core Components of the Integration Process
Calculator outputs rely on historical datasets that capture seasonal variations in team performance, yet these outputs gain accuracy only when synchronized with continuous live streams. Experts have observed that a static model quickly loses relevance once a key defender suffers an injury or when court conditions change during a tennis match. Live streams supply variables such as current serve percentages, break-point conversion rates, and pitch-surface temperature, allowing the calculator to recalibrate probabilities without manual intervention.
Software platforms pull data from multiple sources including official league APIs and stadium sensors, then route the information through modular scripts that apply seasonal weighting factors. One script might increase the value assigned to home-team overs in northern European leagues during late autumn because historical records indicate slower pitch speeds favor attacking styles. Another script adjusts tennis game-total thresholds when humidity levels rise above seasonal norms at outdoor venues.
Application to Football Selections
Football analysts apply seasonal rhythm models most effectively during the opening weeks of domestic campaigns when squad rotations remain fluid. Data indicates that newly promoted sides concede more goals in August than in any other month, and calculators incorporate this tendency by elevating over-line probabilities for matches involving those teams. Live streams confirm whether the promoted side has maintained its pre-season scoring rate or whether defensive lapses have already appeared in the opening fixtures.
Stake calculators further refine selections by factoring in fixture congestion that intensifies after international breaks. Observers have tracked how teams traveling across multiple time zones in late summer display measurable drops in pressing intensity during the first half, and models adjust expected-goal figures downward accordingly. The combination of seasonal baseline data and live confirmation of current form produces tighter confidence intervals around projected margins.
Application to Tennis Selections
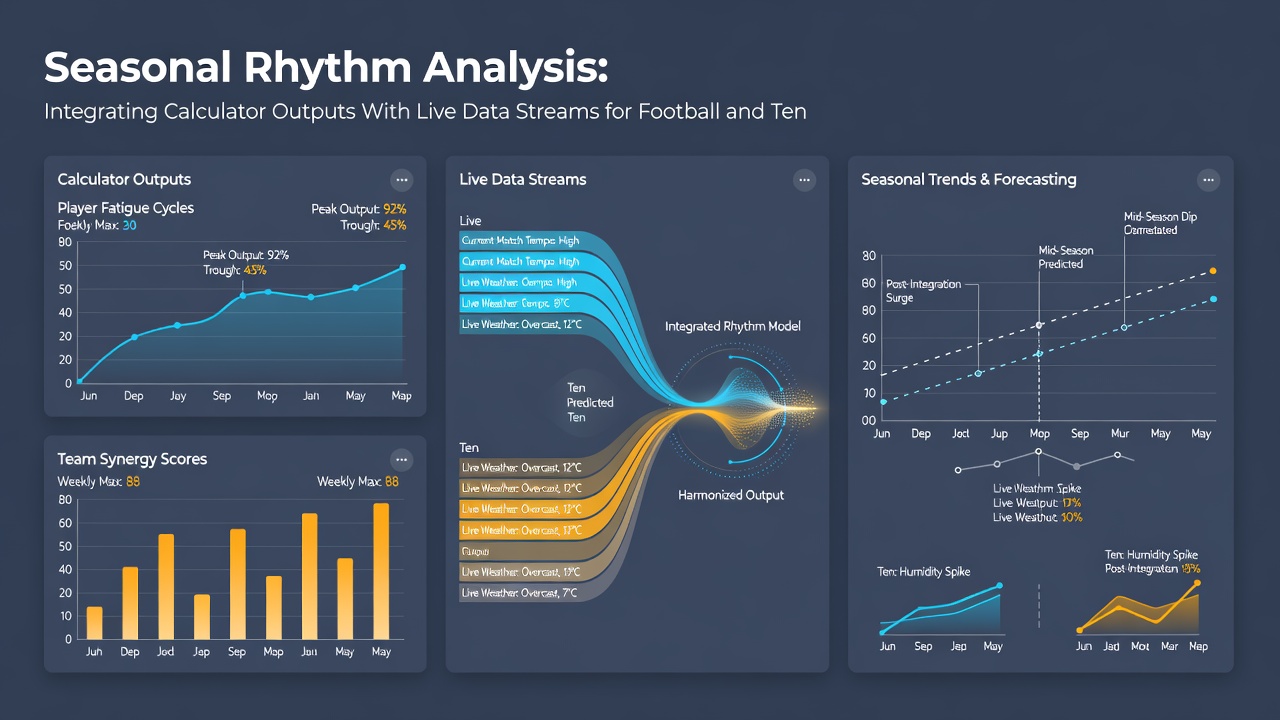
Tennis tournaments follow a calendar that repeats surface transitions and altitude effects each year, and analysts map these transitions onto calculator frameworks. Hard-court swing seasons in North America produce faster rally speeds than clay events, and models automatically widen game-total ranges when live data confirms higher ace percentages than the seasonal average. Researchers at the University of Queensland have published findings on how serve dominance fluctuates with temperature and humidity, and these findings feed directly into scripts that update probabilities every five minutes during matches.
Player-specific seasonal trends also enter the analysis. Certain competitors record stronger second-serve win rates in the first two weeks after a long layoff, while others require three matches to regain full movement. Live streams track movement metrics through optical tracking systems, and calculators compare current readings against the player's historical post-layoff profile to identify value opportunities in game or set markets.
Technical Synchronization Methods
Integration occurs through application programming interfaces that push live metrics into calculation engines at fixed intervals. A typical workflow begins with a seasonal profile generator that loads multi-year averages for the relevant competition phase, then overlays current match data to produce updated probabilities. Any deviation exceeding a preset threshold triggers an alert that prompts the calculator to re-run the value assessment.
According to reports from the European Gaming and Betting Association, platforms that maintain continuous synchronization between historical models and live feeds achieve higher consistency in identifying mispriced lines across both football and tennis. The same reports note that synchronization latency below three seconds allows traders to adjust stakes before odds move in response to the same information.
Conclusion
Seasonal rhythm analysis gains practical value only when calculator outputs remain connected to live data streams that reflect unfolding events. Football and tennis both present recurring calendar-based patterns that statistical models can quantify, yet those models require constant refreshment from real-time sources to stay aligned with actual conditions. Organizations that maintain robust data pipelines between historical archives and live feeds produce selections that account for both long-term cycles and immediate variables, resulting in more stable performance metrics across changing seasons.