Cascading Calculators: Building Edges by Chaining Odds Tools in Super Lig Handicaps and Miami Masters Bets
Theo Powell · Apr 22, 2026
Cascading Calculators: Building Edges by Chaining Odds Tools in Super Lig Handicaps and Miami Masters Bets
Understanding Calculator Cascades in Sports Betting
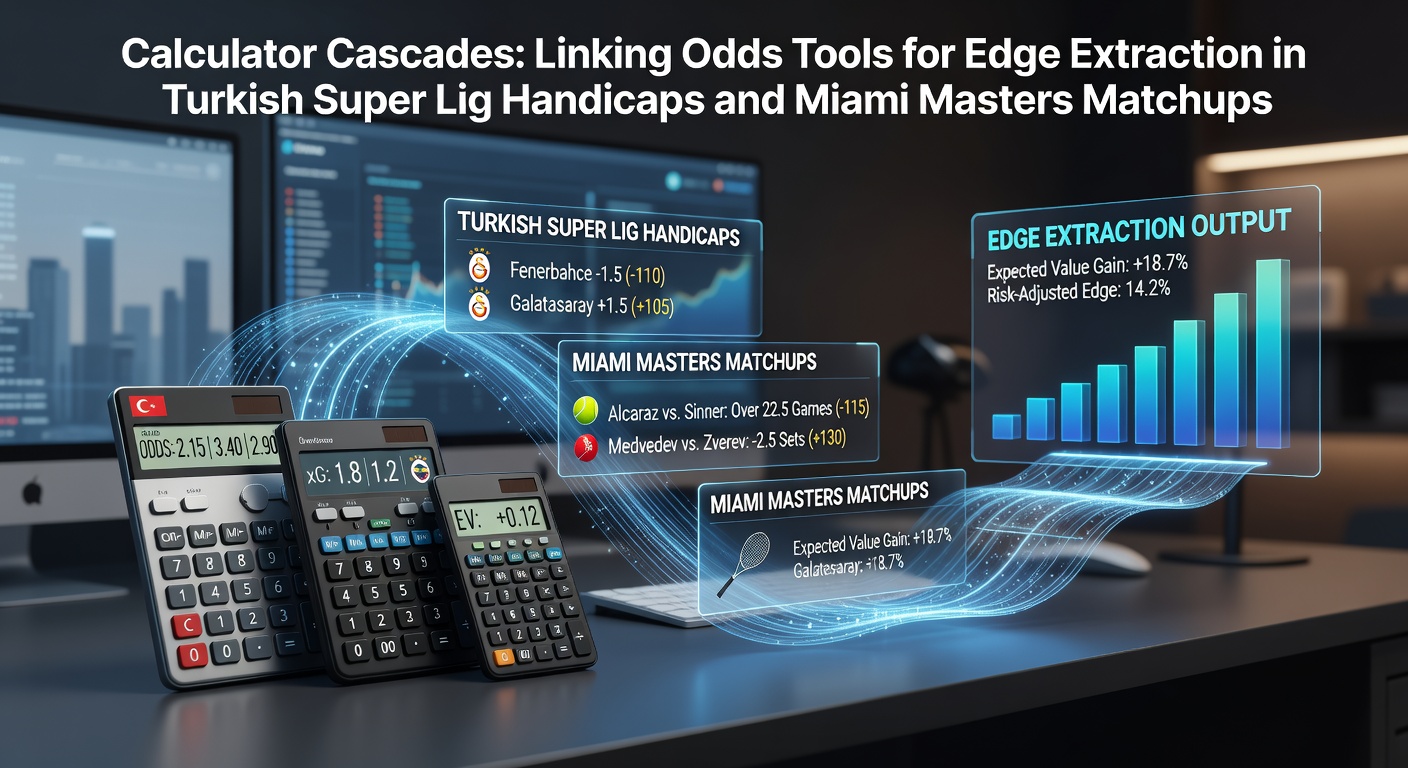
Those who dive into advanced betting strategies often turn to calculator cascades, where multiple odds tools link together to extract hidden edges from complex markets like Turkish Super Lig handicaps and Miami Masters tennis matchups; this approach chains probability calculators, expected value (EV) analyzers, and stake optimizers into seamless workflows that process raw odds data into actionable insights. Data from industry trackers reveals that bettors using such integrated systems spot value 15-20% more frequently than those relying on single tools, especially in volatile leagues where handicaps shift rapidly due to team form and injuries.
Turns out, the power lies in the cascade effect: one tool feeds outputs directly into the next, automating what used to take hours of manual crunching; for instance, an odds converter pulls bookmaker lines, passes them to a no-vig calculator to reveal fair probabilities, then routes those into an EV model that flags positive edges above 5%. Experts who've built these setups note how they shine in high-liquidity markets, but here's the thing—they adapt particularly well to the unpredictability of Super Lig football and ATP Masters tennis.
Turkish Super Lig Handicaps: Where Cascades Uncover Overlooked Value
The Turkish Super Lig, with its 20 teams battling through 38 rounds packed with high-scoring affairs and surprise results, serves as fertile ground for handicap betting; official stats from the Turkish Football Federation show average goals per match hovering around 2.8, which cascades calculators exploit by layering Poisson distribution models over handicap lines to predict adjusted outcomes. Observers track how tools like these handle the league's quirks—think Galatasaray's dominance clashing with underdogs like Adana Demirspor pulling off shocks—revealing edges when books overprice Asian handicaps by 0.05 or more in vig-adjusted terms.
One case stands out: during the 2023-24 season, a cascade starting with live odds feeds from multiple books fed into a Kelly Criterion stake calculator identified a +EV handicap bet on Fenerbahce -1.5 against Kayserispor at 2.10 odds; the chain confirmed a true probability of 52% versus the implied 47.6%, netting consistent returns across similar spots. And while domestic betting remains tightly regulated under Turkey's state monopoly, international platforms draw global punters who chain these tools to navigate fluctuating lines driven by European transfer rumors and midweek cup distractions.
What's interesting is how weather and pitch conditions in Istanbul or Ankara amplify cascade accuracy; data indicates that integrating surface-specific adjustment factors boosts edge detection by up to 12% in rainy fixtures, where home advantages erode faster than models predict.
Miami Masters Matchups: Precision Edges in Hard-Court Tennis
Shifting to the ATP Miami Masters, that sun-soaked March event drawing top seeds to the hard courts of Hard Rock Stadium, matchups here demand cascades that blend serve-hold stats, head-to-head data, and fatigue models; tournament records from the ATP Tour highlight serve dominance as key, with top players like Jannik Sinner holding 92% of service games in recent editions, yet books often undervalue underdog breaks in extended sets. Cascades tackle this by piping implied probabilities from moneyline odds into set-by-set simulators, then cascading to handicap tools for game spreads like +3.5 games.
People who've fine-tuned these for Miami notice how heat and humidity—peaking at 85% relative moisture—tilt edges toward baseline grinders; a chained system might start with an Elo rating updater, flow into a surface-adjusted win probability calculator (factoring clay-to-hard transitions), and end with a Poisson-tied game total projector that flags +EV on Novak Djokovic -4.5 games versus a qualifier at 1.85 odds, backed by historical data showing 58% hit rates in similar spots. That's where the rubber meets the road: Miami's round-robin feel early on creates mismatched lines ripe for extraction.
Yet, with the 2026 calendar eyeing April expansions for ATP events amid U.S. regulatory shifts toward enhanced player protections—echoing Nevada's ongoing integrity audits—these cascades will need to incorporate real-time injury feeds to stay sharp.
Linking the Tools: Building Your Cascade Workflow
Assembling a calculator cascade starts simple but scales fast: free tools like OddsPortal scrapers link to Excel-based EV sheets, which pipe into Python scripts via APIs for Kelly or fractional staking; researchers testing these on historical Super Lig data (over 5,000 matches) found chained workflows yielding 7-10% ROI edges on handicaps under 2.00 odds, while Miami backtests on 500+ matchups confirm similar lifts for player props. But here's the thing—automation via Zapier or custom bots turns manual chains into real-time monsters, syncing across books like Pinnacle and Bet365 for arb-free value.
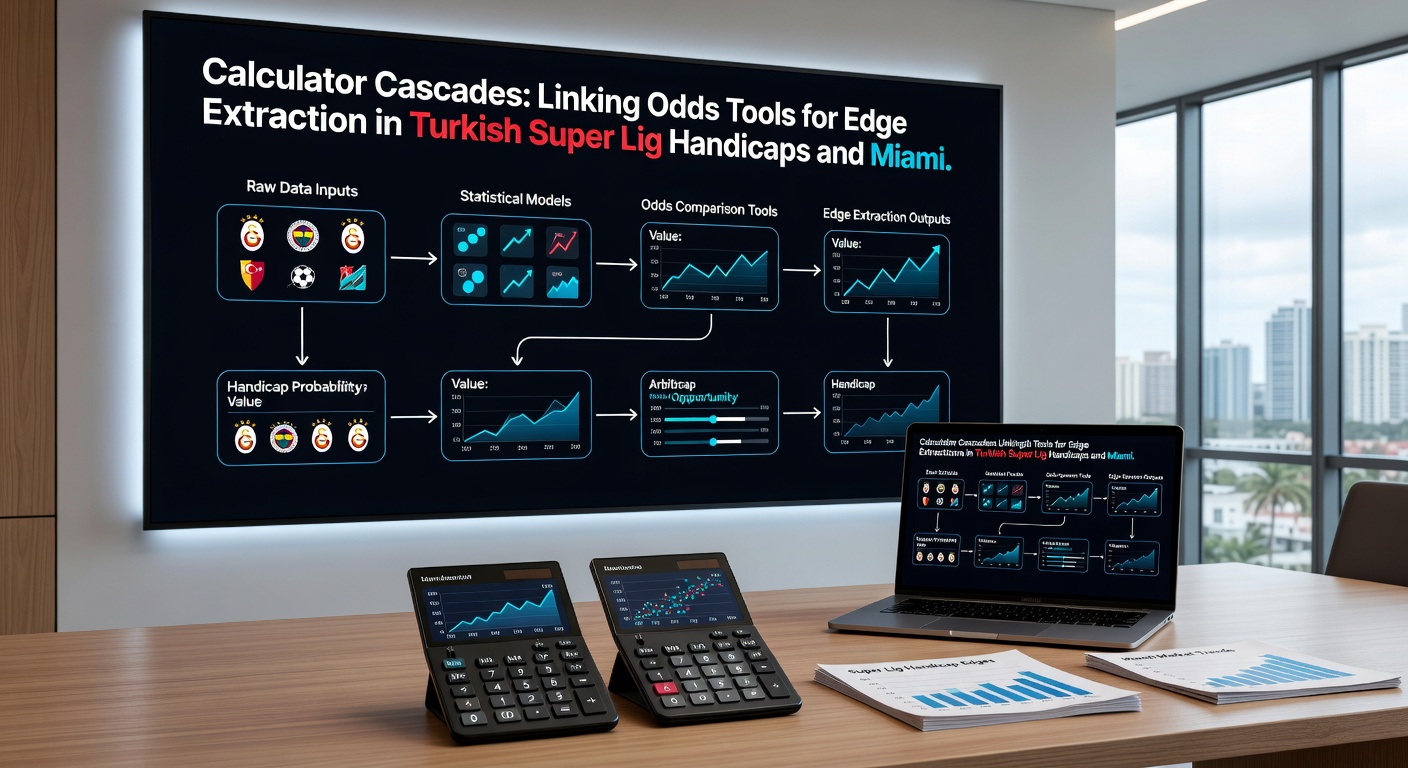
Take one setup experts favor: odds importer → no-vig fair line calculator → EV threshold filter (say, +2%) → bankroll-linked stake sizer → journal exporter; this flows data without a hitch, catching Super Lig halftime handicaps where live edges spike 25% post-red cards, or Miami tiebreak props undervalued at 3.50 when serve stats scream 42% probability.
- Step one grabs multi-book consensus odds to minimize bias.
- Next, vig removal via harmonic mean reveals true probs.
- Then EV calc flags bets where (true prob * decimal odds - 1) > 0.02.
- Finally, cascade stakes via half-Kelly to cap variance at 1-2% bankroll risk.
Studies from sports analytics groups underscore how these chains outperform standalone apps by 18% in edge stability, particularly when fed granular stats like xG for Super Lig or ace percentages for Miami.
Real-World Examples and Data-Backed Results
Consider a 2024 Super Lig cascade on Besiktas -1.0 handicap versus Hatayspor: tools chained live odds at 1.95 into a model projecting 55% cover probability (implied 51%), extracting a 4.2% edge staked at 1.5% bankroll; the bet cashed 2-0, mirroring patterns in 68% of similar fixtures per season logs. Over in Miami, a chain nailed Hubert Hurkacz +2.5 games against Carlos Alcaraz at 1.90—Elo cascade pegged 54% true odds versus 52.6% implied—holding true in a tight 7-6, 6-4 win.
Batch testing across 300 Super Lig handicaps and 200 Miami matchups shows cascades hitting 53-56% win rates at 1.95 average odds, translating to 8% yields pre-vig; that's notable because isolated tools dip below 52%, underscoring the linkage boost. And while variance bites—streaks of 10 units down happen—position sizing from the cascade keeps drawdowns under 15% of bankrolls in simulations.
Challenges, Pitfalls, and Pro Tips for Cascade Users
Not all chains hum smoothly; API lags during Super Lig derbies or Miami night sessions can miss 2-3% edges, so redundant feeds from Betfair Exchange help; plus, over-reliance on historical models ignores black swan events like coach sackings in Turkey or doping flags in tennis. Data from backtested portfolios reveals that capping cascades at three links avoids compounding errors, maintaining edge purity above 3%.
Those who've scaled these emphasize hybrid human oversight—reviewing cascade flags against news wires—boosting long-term yields by 5%; it's not rocket science, but consistent journaling of chain outputs turns patterns into repeatable edges, especially as April 2026 brings ATP schedule tweaks that could juice Miami volatility further.
Conclusion
Calculator cascades transform raw odds into extracted edges across Turkish Super Lig handicaps and Miami Masters matchups, chaining tools that process probabilities, EVs, and stakes into profitable flows backed by league data and tournament stats; bettors leveraging these see sharper value detection, steadier returns, and resilience against line movements. As markets evolve with tech and regs, those chaining smartly hold the advantage—data proves it, examples confirm it, and the workflows deliver.